MAPE (Mean Absolute Percentage Error)
Before calculating MAPE, we should know the other terms related to MAPE. I will try to explain formulas and terms with an example corresponding to each term and formula.
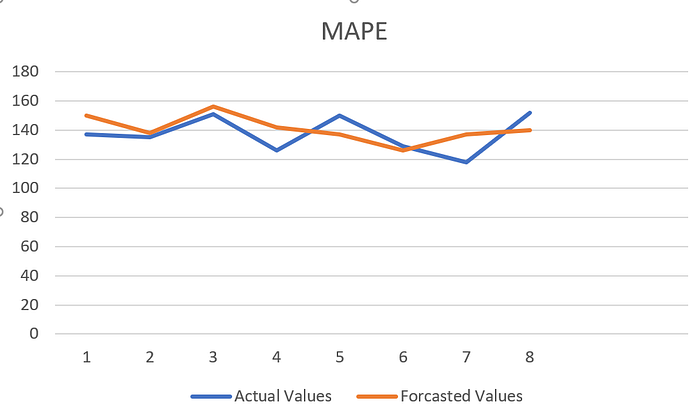
Let’s take first row in the picture to explain each term and formula.

Yt = Actual observation for the time t = 137
Ft = Forecast for the same period
= To forecast, lot of methods we can consider. This will be defined as per business rule. This may be like previous year same period average value or previous month value etc.
= 150 is as per the table
et = Error = How far is our forecast from the actual observation at time t.
= Yt — Ft
= Actual Observation — Forecast (For the same Time)
= 137–150 = -13 (Same can observed in 4th column first row)
Mean Error (ME) = Average Error
ME = Sum of all the Errors / No of Observations
ME = -28 / 8 = -3.5
So, what this -3.5 defines, on an average our forecast is -3.5 points away from the actual values.
Absolute Error: (5th column)
If we are considering Mean Error as a measurement of accuracy, due to its negative and positive sign values Mean Error will show as small number. So, to maximum the mean value we will convert error terms are absolute values.
Absolute Error = |Yt — Ft|
= |137–150| = |-13| = 13
Mean Absolute Error = Average of all absolute error observations
= 84 / 8 = 10.5
Mean Squared Error: (6th Column)
Mean error -3.5 with Mean absolute error 10.5, we fell that there is more gap between actual value and forecasted value if Mean absolute error is considered compare to Mean Error. So, we will take precautions to get better forecasted values. Other than absolute values, we have one more term called Mean Squared Error, which maximizes the bigger errors and nullify the smaller errors. Let me explain this with an example.
If error is 0.1, then square of error is 0.01
If error is 10, then square of error is 100.
With this you can observe lesser value is becoming less and bigger error is magnified.
Mean Squared Error = Average of all squared errors
= 1142 / 8
= 142.75 (More precautions will be taken when we see this much bigger number)
Percentage Error (PEt): (7th Column)
At a particular time how much percentage our forecast is deviated from actual value.
= (Yt — Ft) * 100 / Yt
= (137–150) *100 / 137
= -9.48905
Mean Percentage Error: Average of all percentages
MPE = -24.9357 / 8
= -3.117
So, now are familiar with all the terms to understand MAPE better.
MAPE = Mean absolute Percentage Error (8th Column)
We know that 2 methods i.e absolute values or square values will maximize the original errors. In this case we are considering Absolute value as measure.
Mean Absolute Percentage Error = | (Yt — Ft) / Yt | *100
= 62.70962 / 8
= 7.839
So, our forecasted mean values are 7.839% away from the actual mean values.
So still if you want show more maximized numbers then we can consider Mean Squared Percentage Error (MSPE).
I hope you guys got to know about MAPE. Please encourage with me your claps.